Every country in the world stands at risk of having its workforce population replaced by AI automation. However, some countries will be more affected than others. This section analyzes the extent of the AI automation invasion per country by calculating the percentage of a country’s labor force that is at high risk of AI automation in the future.
COUNTRIES WILL BE MOST AFFECTED BY AI AUTOMATION
A WORLD MAP OF THE INVASION OF ARTIFICIAL INTELLIGENCE TAKING OVER JOBS
For many members of the global workforce, the rise of artificial intelligence spells doom. The majority of the employed population feels it is only a matter of time before human-like computer intelligence takes over the workforce. But is there any truth to these fears? Will AI take over jobs, and if so, which labor groups and countries will be most affected by AI automation? We have compiled this report to answer such questions about the impact of AI on the job market.
HOW DID WE DO?
First, we get data from WillRobotsTakeMyJob.com on the automation risk of each job. According to Willrobotstakemyjob, the automation risk is calculated based on the abilities, knowledge, skills and activities required in order to do the job. The author used the same method as a 2013 study by Professor Carl Benedikt Frey and Professor Michael A. Osborne from Oxford Martin School. You can find more details on how the site calculates the automation risk here. Second, we put those jobs into professional groups to find out what the average risk of automation is for each group. To figure out how much of each country's workforce is highly exposed to AI and robot automation, we use data from the International Labor Organization (ilo.org) about how many people work in each occupational group in each country. We then combine this information with the average automation risk of each occupational group. The methodology is described in detail at the end of this article.
KEY FINDINGS
64%
of [worldwide workforce] is at high risk of AI automation.
74%
of [US workforce] is at high risk of AI taking over their jobs in the future, which equals to more than 110 million workers.

TOP 3 NATIONS THAT WILL BE HARDEST HIT BY AI JOB AUTOMATION IN EACH REGION
-
AFRICA
- 1. Zambia
- 2. Angola
- 3. Uganda
-
ASIA & PACIFIC
- 1. Bhutan
- 2. Pakistan
- 3. India
-
EUROPE
- 1. Armenia
- 2. North Macedonia
- 3. Estonia
-
MIDDLE EAST
- 1. Iran
- 2. Jordan
- 3. Egypt
-
SOUTH/ LATIN
AMERICA- 1. Bolivia
- 2. Mexico
- 3. Saint Lucia
TOP 5 NATIONS MOST / LEAST AFFECTED BY AI AUTOMATION
MOST
LEAST
-
 Zambia
-
 Bhutan
-
 Angola
-
 Armenia
-
 Pakistan
-
 Trinidad & Tobago
-
 Botswana
-
 Slovakia
-
 Panama
-
 Singapore
JOBS EXPOSING TO HIGHEST RISKS OF AI AUTOMATION:
| Industry | Occupation | Average AI Automation Risk |
|---|---|---|
| Administrative & support service activities |
Clerical support workers | 89.5% |
| Administrative & support service activities |
Service and sales workers | 85.7% |
| Manufacturing | Plant and machine operators, and assemblers |
86.5% |
| Manufacturing | Craft and related trades workers | 84.4% |
| Transportation and storage | Elementary occupations | 81.5% |
Section 1
A WORLD MAP OF THE AI JOB AUTOMATION INVASION
64% Of the world’s Labor Force Is Highly Vulnerable to AI Automation in the Near Future.
More specifically, the World Economic Forum’s Future of Jobs Report 2020 indicated that AI might render at least 85 million of the world’s labor force unemployed by 2020. However, other stakeholders, like Goldman Sachs place the statistics on AI-related job losses at 300 million.
Conversely, the World Economic Forum report also says that AI technology can create at least 97 million new jobs within the same period. So, all is not lost, but there is a need to scrutinize the introduction of AI into the workplace to ensure the technology’s demerits do not outweigh its benefits.
Half or More of the Workforce in 82 of the 85 Countries Studied Is at High Risk of Becoming Automated in The Future.
From our findings, Singapore is the only country with less than a 40% chance of its employed population being gravely affected by the rise of AI work automation. In fact, only 3 of the 85 countries listed in the table above have less than 50% of their workforce heavily threatened by AI.
All of the Top 10 Countries Where Jobs Are Least Likely to Be Lost to Automation Belong to either the High Income or Upper Middle Income Groups.
Countries with high and upper-middle-income rates are less likely to feel the impact of AI job automation.
Africa is the Most Vulnerable to High Risk of Jobs Being Taken by AI.
Africa is a tech hub on the rise. However, most countries on this continent have not embraced work automation extensively, leaving many employees at high risk of losing their jobs once there’s a move to AI.
Percentage of Workforce at High Risk of AI Automation, World Map
- 0 30
- 40
- 50
- 60
- 70
- 80
- 100
And that’s our summary of the tabulated findings. Please find the full data in the the table below:
PERCENTAGE OF WORKFORCE AT HIGH RISK
OF AI AUTOMATION, BY COUNTRY
| Country | Region | Income | % of workforce at high risk of automation |
|---|---|---|---|
| Zambia | Africa | Lower middle income | 82.76% |
| Bhutan | Asia & Pacific | Lower middle income | 82.48% |
| Angola | Africa | Lower middle income | 82.41% |
| Armenia | Europe | Upper middle income | 81.33% |
| Pakistan | Asia & Pacific | Lower middle income | 80.58% |
| Uganda | Africa | Low income | 80.19% |
| North Macedonia | Europe | Upper middle income | 79.89% |
| Zimbabwe | Africa | Lower middle income | 79.87% |
| Estonia | Europe | High income | 79.84% |
| Republic of Moldova | Europe | Upper middle income | 79.84% |
| Bolivia | South/Latin America | Lower middle income | 79.81% |
| India | Asia & Pacific | Lower middle income | 79.40% |
| Mexico | South/Latin America | Upper middle income | 79.40% |
| Saint Lucia | South/Latin America | Upper middle income | 78.80% |
| Rwanda | Africa | Low income | 78.77% |
| Russia | Europe | Upper middle income | 78.71% |
| Kosovo | South/Latin America | Upper middle income | 78.69% |
| Timor-Leste | Asia & Pacific | Lower middle income | 78.68% |
| Bosnia and Herzegovina | Europe | Upper middle income | 78.65% |
| Ecuador | South/Latin America | Upper middle income | 78.64% |
| Ethiopia | Africa | Low income | 78.32% |
| Netherlands | Europe | High income | 78.31% |
| Viet Nam | Asia & Pacific | Lower middle income | 78.24% |
| Cyprus | Europe | High income | 77.51% |
| Belgium | Europe | High income | 77.45% |
| Iran | Middle East | Lower middle income | 77.20% |
| Lithuania | Europe | High income | 77.14% |
| Belize | South/Latin America | Lower middle income | 77.12% |
| Latvia | Europe | High income | 77.04% |
| Romania | Europe | Upper middle income | 76.91% |
| Jordan | Middle East | Upper middle income | 76.86% |
| Argentina | South/Latin America | Upper middle income | 76.81% |
| Egypt | Middle East | Lower middle income | 76.78% |
| United Arab Emirates | Middle East | High income | 75.73% |
| Croatia | Europe | High income | 75.66% |
| Thailand | Asia & Pacific | Upper middle income | 75.61% |
| Malta | Europe | High income | 75.43% |
| France | Europe | High income | 75.15% |
| Spain | Europe | High income | 74.96% |
| Finland | Europe | High income | 74.86% |
| Greece | Europe | High income | 74.83% |
| Poland | Europe | High income | 74.63% |
| Republic of Korea | Asia & Pacific | High income | 74.28% |
| United States | North America | High income | 74.18% |
| Mongolia | Asia & Pacific | Lower middle income | 73.96% |
| Austria | Europe | High income | 73.40% |
| Norway | Europe | High income | 73.33% |
| Italy | Europe | High income | 72.24% |
| Germany | Europe | High income | 72.17% |
| Brunei Darussalam | Asia & Pacific | High income | 71.83% |
| Colombia | South/Latin America | Upper middle income | 71.70% |
| Portugal | Europe | High income | 71.62% |
| Costa Rica | South/Latin America | Upper middle income | 70.86% |
| Iceland | Europe | High income | 70.18% |
| Switzerland | Europe | High income | 69.69% |
| Sweden | Europe | High income | 69.53% |
| Afghanistan | Asia & Pacific | Low income | 69.40% |
| El Salvador | South/Latin America | Lower middle income | 69.08% |
| Hungary | Europe | High income | 67.89% |
| Luxembourg | Europe | High income | 67.83% |
| Dominican Republic | South/Latin America | Upper middle income | 67.67% |
| Occupied Palestinian Territory | Arab States | - missing data - | 66.83% |
| Slovenia | Europe | High income | 66.74% |
| Philippines | Asia & Pacific | Lower middle income | 66.57% |
| Comoros | Arab States | Lower middle income | 66.18% |
| Tonga | Asia & Pacific | Upper middle income | 66.17% |
| Türkiye | Europe | Upper middle income | 65.74% |
| Brazil | South/Latin America | Upper middle income | 64.74% |
| Mauritius | Africa | Upper middle income | 64.50% |
| Serbia | Europe | Upper middle income | 63.27% |
| Ireland | Europe | High income | 63.07% |
| Israel | Middle East | High income | 62.90% |
| Iraq | Middle East | Upper middle income | 61.01% |
| Bulgaria | Europe | Upper middle income | 60.76% |
| Kyrgyzstan | Asia & Pacific | Low income | 60.35% |
| Czechia | Europe | High income | 58.25% |
| Uruguay | South/Latin America | High income | 57.45% |
| Belarus | Europe | Upper middle income | 56.73% |
| Chile | South/Latin America | High income | 56.69% |
| Denmark | Europe | High income | 55.79% |
| Trinidad and Tobago | South/Latin America | High income | 54.65% |
| Botswana | Africa | Upper middle income | 53.18% |
| Slovakia | Europe | High income | 46.79% |
| Panama | South/Latin America | Upper middle income | 44.57% |
| Singapore | Asia & Pacific | High income | 19.22% |
We compiled the automation risk data of each job on Willrobotstakemyjob.com and the number of jobs in each occupational category to determine the nations where AI job automation will have the most significant impact.

This image is licensed under the Creative Commons Attribution-Share Alike 4.0 International License - www.creativecommons.org/license/by-sa/4.0t
METHODOLOGY
- We compile information regarding the automation risk of each job at https://willrobotstakemyjob.com/. There are a total of 897 jobs.
- Then, we put these jobs into groups based on what they were. From there, we have the average automation risk of each occupational group.
- Then, we use data from https://ilostat.ilo.org/data/# to figure out how many people work in that group of jobs in each country. All together, there are 105 countries.
- Now that we know the average risk of AI automation for each job group and how many people work in that group, we can figure out what percentage of the workforce is at a high risk of AI automation. High risk is defined by willrobotstakemyjob.com as 61 percent or more.
- Countries impacted the most by AI automation = Countries with the highest percentage of labor force at high risk of AI automation
OTHER DATA SOURCES:
Section 2
US MAP OF AI JOB AUTOMATION INVASION
The U.S. is also susceptible to the AI job automation invasion. Let's look at how each state in the United States is dealing with the threat of AI replacement.
74.18% Of the US Workforce Is at Significant Risk of Being Replaced by AI in the Future.
Artificial intelligence efforts in the U.S. pose a significant threat to at least 74.18% of jobs in the country. This rate of job loss may not be immediate, but AI’s rapidly growing capabilities can easily replace human labor in the future.
Colorado, Vermont, New Jersey, Connecticut, and Alaska Are the Top Five States With the Highest Percentage of Their Workforce at Risk of Being Replaced by AI.
Two-thirds of the workforce in Colorado, Vermont, New Jersey, Connecticut, and Alaska are at significant risks of being replaced by human-like computer intelligence in the future. These states all have over a 67% chance of an AI workspace takeover.
At 20.4% and 21.1%, respectively, Kentucky and the District of Columbia Have the Lowest Percentage of Their Workforce at Significant Risk of Being Replaced by AI.
Despite major indicators showing that AI can take over the job market, there is some hope for most states in the U.S. Our data shows that at least 30 states have less than a 50% chance of AI taking over jobs. The states with the lowest percentage among these are Kentucky and the District of Columbia, which have a 20.4% and 21.1% chance of having their workforce replaced by artificial intelligence technology, respectively.
Percentage of Workforce at High Risk of AI Automation, U.S. Map
- 0 30
- 40
- 50
- 60
- 70
- 80
- 100
PERCENTAGE OF WORKFORCE
AT HIGH RISK OF
AI AUTOMATION, BY STATE
| Rank | State | % of workforce at high risk of AI automation |
|---|---|---|
| 1 | Colorado | 68.6% |
| 2 | Vermont | 68.5% |
| 3 | New Jersey | 67.9% |
| 4 | Connecticut | 67.1% |
| 5 | Alaska | 67.1% |
| 6 | Alabama | 66.9% |
| 7 | Texas | 64.7% |
| 8 | Massachusetts | 64.5% |
| 9 | Guam | 62.0% |
| 10 | Delaware | 62.0% |
| 11 | Virginia | 60.0% |
| 12 | Indiana | 58.3% |
| 13 | Oklahoma | 57.5% |
| 14 | Mississippi | 55.7% |
| 15 | Nevada | 55.7% |
| 16 | Washington | 53.0% |
| 17 | California | 52.7% |
| 18 | Missouri | 51.7% |
| 19 | Nebraska | 51.6% |
| 20 | Pennsylvania | 51.2% |
| 21 | Rhode Island | 51.1% |
| 22 | South Carolina | 51.1% |
| 23 | Florida | 50.6% |
| 24 | Ohio | 50.4% |
| 25 | Illinois | 48.6% |
| 26 | Maryland | 48.2% |
| 27 | North Carolina | 46.8% |
| 28 | Iowa | 46.2% |
| 29 | Arkansas | 46.2% |
| 30 | Virgin Islands | 44.4% |
| 31 | Arizona | 44.0% |
| 32 | Wisconsin | 42.3% |
| 33 | New Mexico | 42.1% |
| 34 | Idaho | 41.9% |
| 35 | Montana | 41.8% |
| 36 | Louisiana | 41.3% |
| 37 | Oregon | 40.3% |
| 38 | Utah | 40.1% |
| 39 | Wyoming | 39.8% |
| 40 | Maine | 38.9% |
| 41 | Hawaii | 38.4% |
| 42 | West Virginia | 37.9% |
| 43 | Tennessee | 37.4% |
| 44 | South Dakota | 37.0% |
| 45 | Michigan | 36.2% |
| 46 | Georgia | 34.6% |
| 47 | Puerto Rico | 33.3% |
| 48 | Minnesota | 30.0% |
| 49 | New York | 28.5% |
| 50 | New Hampshire | 28.2% |
| 51 | North Dakota | 28.2% |
| 52 | Kansas | 27.7% |
| 53 | District of Columbia | 21.4% |
| 54 | Kentucky | 20.4% |
We compiled the automation risk data of each job on Willrobotstakemyjob.com and the number of jobs in each occupational category to determine the nations where AI job automation will have the most significant impact.
This image is licensed under the Creative Commons Attribution-Share Alike 4.0 International License - www.creativecommons.org/license/by-sa/4.0t
METHODOLOGY
- We compile information regarding the automation risk of each job at https://willrobotstakemyjob.com/. There are a total of 897 jobs.
- Then, we put these jobs into groups based on what they were. From there, we have the average automation risk of each occupational group.
- Then, we use data from https://ilostat.ilo.org/data/# to figure out how many people work in that group of jobs in each country. All together, there are 105 countries.
- Now that we know the average risk of AI automation for each job group and how many people work in that group, we can figure out what percentage of the workforce is at a high risk of AI automation. High risk is defined by willrobotstakemyjob.com as 61 percent or more.
- Countries impacted the most by AI automation = Countries with the highest percentage of labor force at high risk of AI automation
OTHER DATA SOURCES:
Section 3
JOBS WITH HIGHEST / LOWEST AUTOMATION RISK
Our research also revealed that certain jobs had a higher risk of being replaced by AI than others. By breaking down the industry, occupation, and average AI automation risk, this table and the findings below will help you identify which professions are most endangered.
JOBS WITH HIGHEST / LOWEST AUTOMATION RISK
| Industry | Occupation | % of workforce at high risk of automation |
|---|---|---|
| Administrative & support service activities |
Clerical support workers | 89.5% |
| Administrative & support service activities |
Service and sales workers | 85.7% |
| Manufacturing | Plant and machine operators, and assemblers |
86.5% |
| Manufacturing | Craft and related trades workers | 84.4% |
| Transportation and storage | Elementary occupations | 81.5% |
| Manufacturing | Service and sales workers | 74.3% |
| Transportation and storage | Plant and machine operators, and assemblers | 74.6% |
| Other service activities | Elementary occupations | 72.3% |
| Manufacturing | Professionals | 73.5% |
| Mining and quarrying | Plant and machine operators, and assemblers | 66.9% |
| Financial and insurance activities | Professionals | 68.2% |
| Accommodation and food service activities |
Professionals | 65.0% |
| Agriculture; forestry and fishing | Skilled agricultural, forestry and fishery workers | 65.6% |
| Manufacturing | Technicians and associate professionals | 64.3% |
| Other service activities | Service and sales workers | 57.3% |
| Administrative & support service activities |
Professionals | 63.8% |
| Wholesale and retail trade; repair of motor vehicles and motorcycles |
Service and sales workers | 55.2% |
| Other service activities | Technicians and associate professionals | 52.9% |
| Arts, entertainment and recreation | Technicians and associate professionals | 52.3% |
| Transportation and storage | Professionals | 53.6% |
| Professional, scientific and technical activities |
Clerical support workers | 51.0% |
| Human health and social work activities | Clerical support workers | 70.8% |
| Wholesale and retail trade; repair of motor vehicles and motorcycles |
Technicians and associate professionals | 50.2% |
| Other service activities | Professionals | 45.8% |
| Transportation and storage | Technicians and associate professionals | 60.0% |
| Human health and social work activities | Technicians and associate professionals | 43.5% |
| Construction | Professionals | 39.8% |
| Construction | Technicians and associate professionals | 38.9% |
| Information and communication | Professionals | 43.3% |
| Information and communication | Technicians and associate professionals | 39.5% |
| Professional, scientific and technical activities | Technicians and associate professionals | 33.9% |
| Arts, entertainment and recreation | Professionals | 31.0% |
| Professional, scientific and technical activities | Professionals | 25.1% |
| Education | Professionals | 22.8% |
| Education | Elementary occupations | 17.3% |
| Human health and social work activities | Professionals | 17.6% |
| Public administration and defence; compulsory social security | Professionals | 8.9% |
We compiled the automation risk data of each job on Willrobotstakemyjob.com and the number of jobs in each occupational category to determine the nations where AI job automation will have the most significant impact.
This image is licensed under the Creative Commons Attribution-Share Alike 4.0 International License - www.creativecommons.org/license/by-sa/4.0t
METHODOLOGY
- We compile information regarding the automation risk of each job at https://willrobotstakemyjob.com/. There are a total of 897 jobs.
- Then, we put these jobs into groups based on what they were. From there, we have the average automation risk of each occupational group.
- Then, we use data from https://ilostat.ilo.org/data/# to figure out how many people work in that group of jobs in each country. All together, there are 105 countries.
- Now that we know the average risk of AI automation for each job group and how many people work in that group, we can figure out what percentage of the workforce is at a high risk of AI automation. High risk is defined by willrobotstakemyjob.com as 61 percent or more.
- Countries impacted the most by AI automation = Countries with the highest percentage of labor force at high risk of AI automation
OTHER DATA SOURCES:
Clerical Support Workers in the Field of Administrative and Support Service Activities Face a High Likelihood of Being Replaced by Robots and Artificial Intelligence.
In the near future, clerical workers in the administrative and support service industries have at least a 90% risk of losing their jobs to AI. Trailing closely behind are service and sales workers in the same industry, with an 85.7% chance of job loss.
Next will be plant and machine operators, assemblers, and craft and related trades workers in manufacturing with an 86.5% and 84.4% chance, respectively, and elementary occupations in transport and storage with an 81.5% chance of job loss.
Professionals Employed in the Field of Public Administration and Defense, as Well as Compulsory Social Security, Are Among the Least Likely to Be Affected by the Wave of AI Automation.
The risk of automation-related job loss for employees in public administration, defense, and compulsory social security is as low as 9%. Other occupations with such low stats include elementary education occupations at 17.3%, human health and social work at 17.6%, education professionals at 22.8%, and professional scientific and technical activity workers at 25.1%.
TOP 3 INDUSTRIES WHERE AI AUTOMATION THREATENS EMPLOYMENT THE MOST
81% of manufacturing jobs are at risk of being automated out in the future, followed by 77% of administrative and support service jobs and 70% of transportation and storage jobs.
In contrast, education, with a risk of 18%; human health and social work activities, with a risk of 23%; and public administration and defense; mandatory social security, with a risk of 26%, are the top three industries where jobs are least likely to be replaced by AI and robots in the future.
81.1%

Manufacturing
77.4%

Administrative &
support service
activities
support service
activities
69.7%
Transportation
& storage
& storage
69.7%

Agriculture,
forestry,
& fishing
forestry,
& fishing
61%

Mining &
quarrying
quarrying
69.6%

Activities of households as
employers; undifferentiated
goods- and services-producing
activities of households for
own use
employers; undifferentiated
goods- and services-producing
activities of households for
own use
69.3%

Accommodation &
food service activities
food service activities
68.1%

Financial
& insurance activities
& insurance activities
58.8%

Wholesale & retail
trade; repair of motor
vehicles & motorcycles
trade; repair of motor
vehicles & motorcycles
54.3%

Other
service activities
service activities
50.2%

Electricity, gas,
steam, and air
conditioning supply
steam, and air
conditioning supply
44.3%

Real estate
activities
activities
44.3%

Water supply; sewerage,
waste management,
& remediation activities
waste management,
& remediation activities
43.5%

Construction
40.3%

Information &
communication
communication
38.3%

Arts, entertainment,
& recreation
& recreation
29.6%
Professional, scientific,
& technical activities
& technical activities
26.2%

Public administration
& defense, compulsory
social security
& defense, compulsory
social security
23.4%

Human health &
social work activities
social work activities
18.0%

Education
POSITIONS AT HIGHEST RISK OF BEING REPLACED BY AI
Clerical support positions, plant and machine operators and assemblers, and craft and related trades employees are at the greatest risk of being replaced by AI. Their likelihood of being supplanted by AI in the future exceeds 70%.
OCCUPATION
AVERAGE AUTOMATION RISK (%)
Clerical support workers
78.0%

Plant and machine operators,
& assemblers
& assemblers
77.4%

Craft and related trades workers
73.8%

Service and sales workers
65.6%

Skilled agricultural, forestry,
& fishery workers
& fishery workers
51.7%

Elementary occupations
44.3%

Technicians & associate
professionals
professionals
43.7%

Professionals
35.8%

Managers
28.5%

Section 4
DOES WAGE OR EDUCATION IMPACT AUTOMATION RISK OF A JOB?
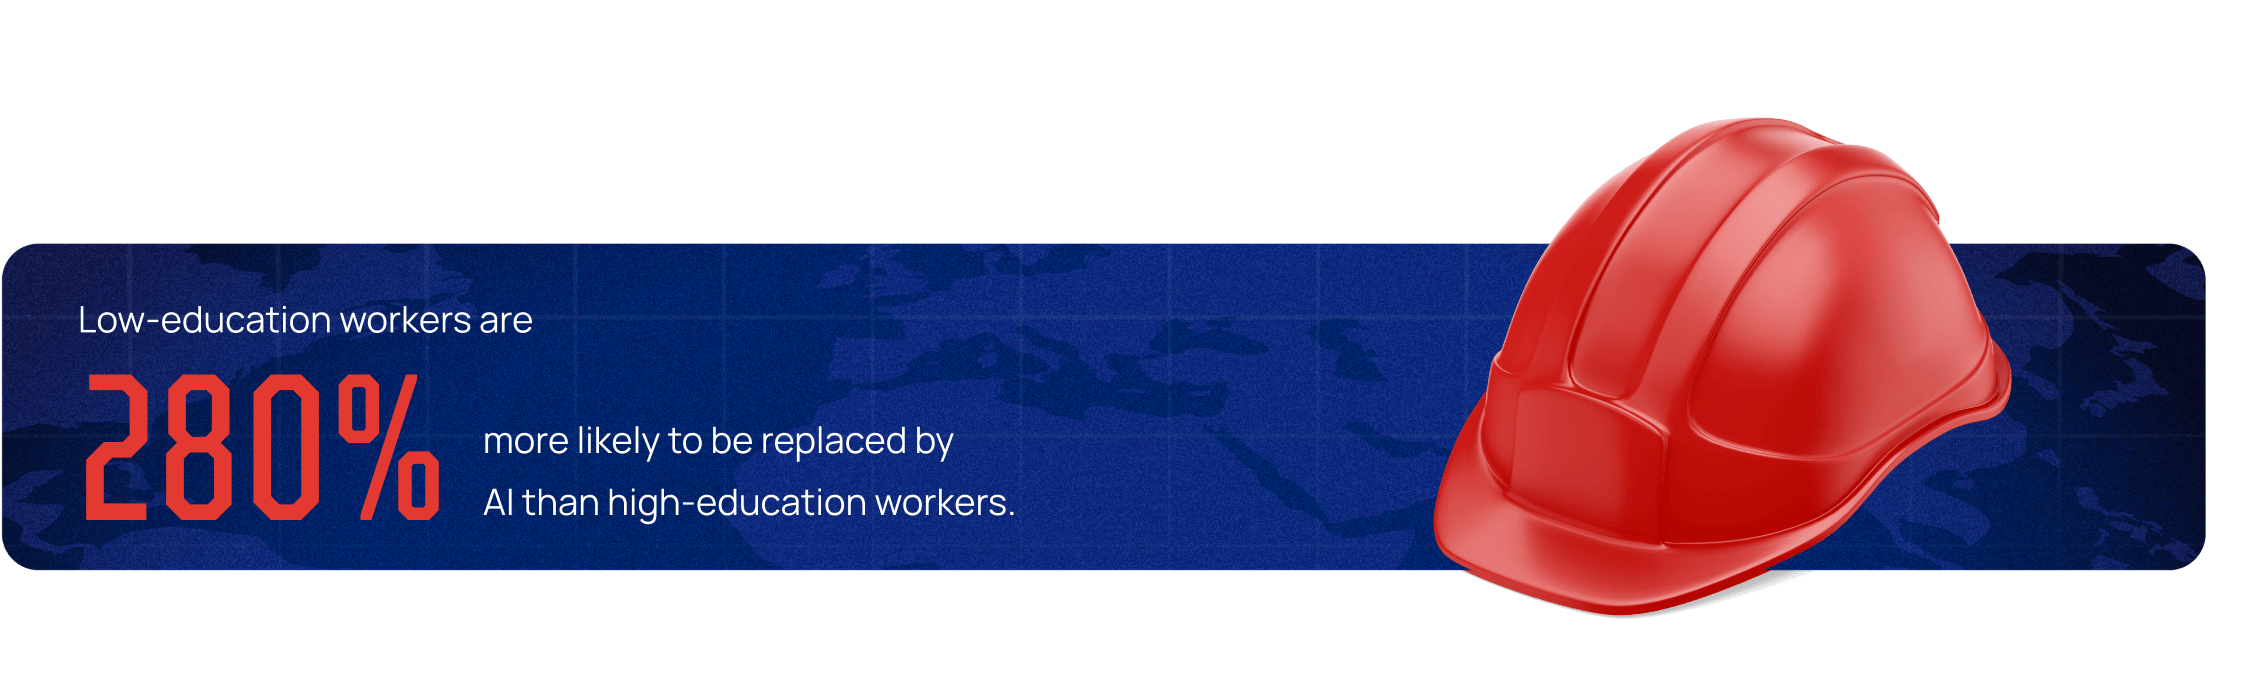
Further findings reveal that low-education workers are 280% more likely than high-education workers to be at high risk of being replaced by AI. In this case, "higher education" refers to a bachelor's degree or higher educational qualification. Here's a table that breaks down these results.
| EDUCATION LEVEL | % OF LABOR AT HIGH RISK OF AI AUTOMATION |
|---|---|
| High Education Labor | 15% |
| Low Education Labor | 43% |
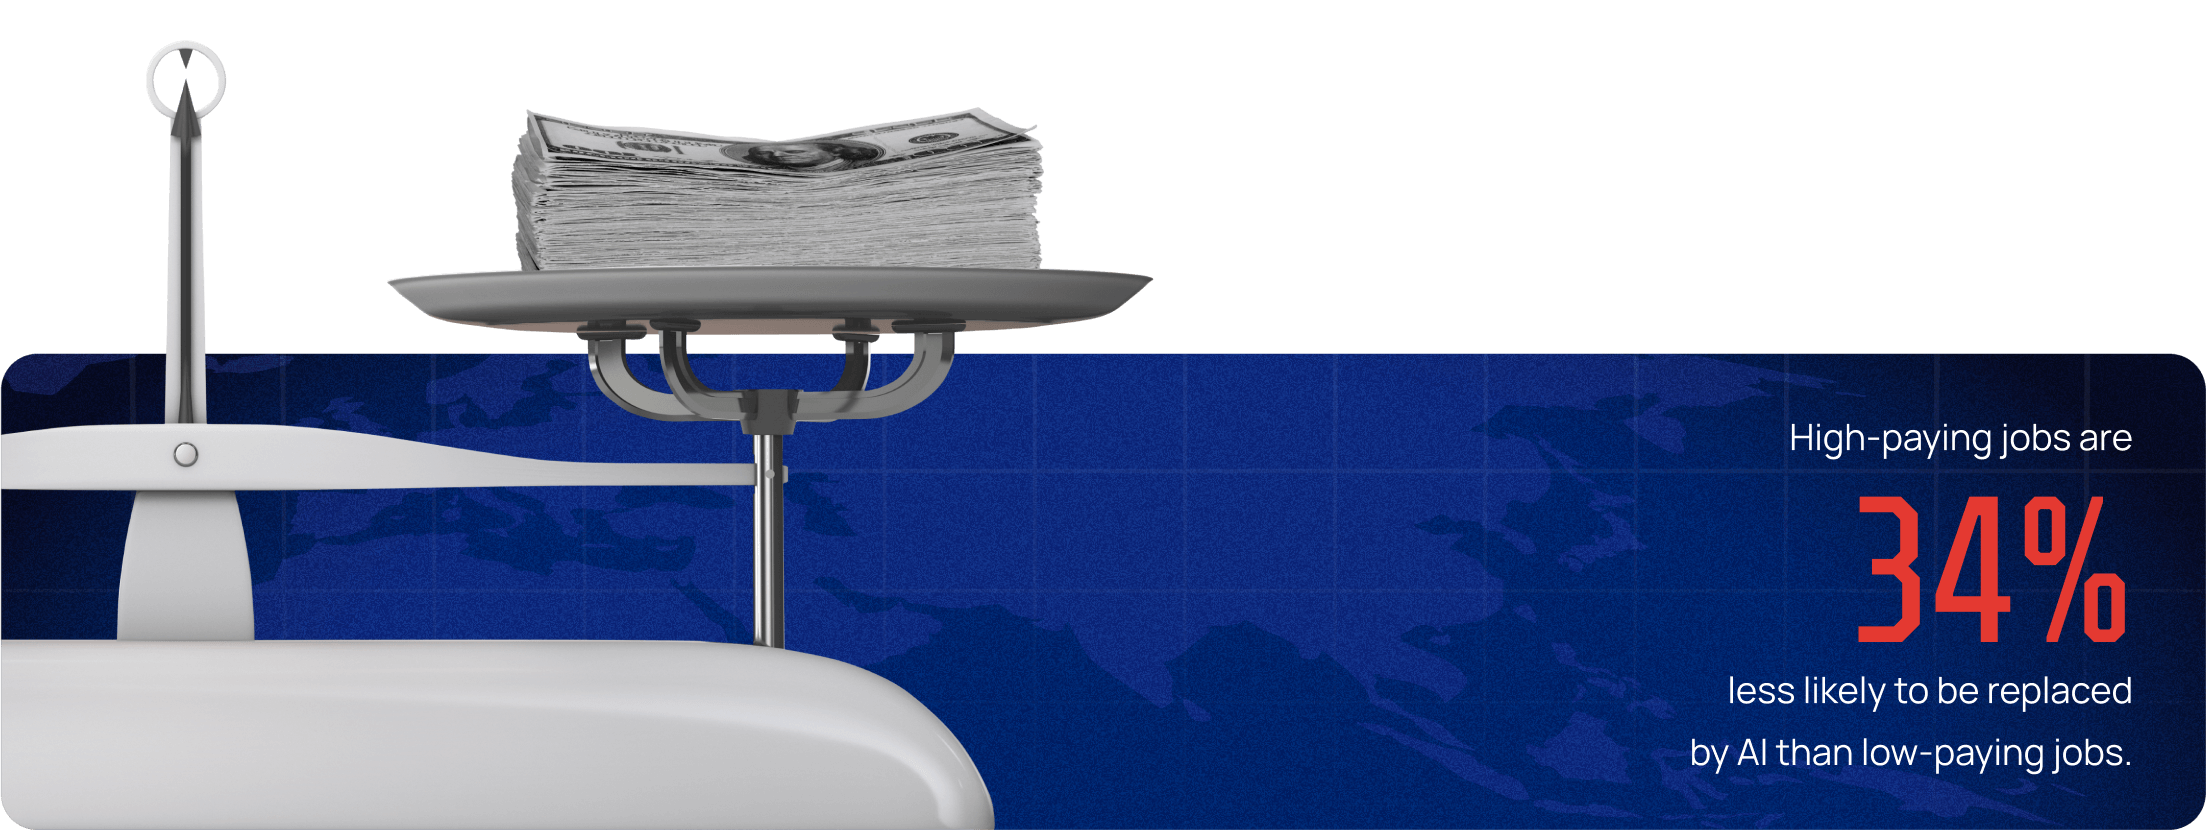
Additionally, higher-paying jobs are 34% less likely to be displaced by AI than lower-paying jobs. Low-paying occupations here refer to jobs with wages below the national average wage of $74,738. Below is a table that summarizes these findings.
| WAGE | Average AI Automation Risk |
|---|---|
| High-paying Jobs | 35.12% |
| Low-paying Jobs | 87.81% |
METHODOLOGY AND LIMITATIONS
This research followed a structured methodology to achieve the most accurate result possible. Below is a step-by-step explanation of the approach, process, and resources used to obtain the statistics we have presented.
METHODOLOGY
- We compile information regarding the automation risk of each job at https://willrobotstakemyjob.com/. There are a total of 897 jobs.
- Then, we put these jobs into groups based on what they were. From there, we have the average automation risk of each occupational group.
- Then, we use data from https://ilostat.ilo.org/data/# to figure out how many people work in that group of jobs in each country. All together, there are 105 countries.
- Now that we know the average risk of AI automation for each job group and how many people work in that group, we can figure out what percentage of the workforce is at a high risk of AI automation. High risk is defined by willrobotstakemyjob.com as 61 percent or more.
- Countries impacted the most by AI automation = Countries with the highest percentage of labor force at high risk of AI automation
OTHER DATA SOURCES:
https://www.bls.gov/oes/tables.htm
https://www.bls.gov/emp/tables/education-and-training-by-occupation.htm
https://datatopics.worldbank.org/world-development-indicators/the-world-by-income-and-region.html
LIMITATIONS
- Wage and Education are restricted geographically within the United States.
- Labor statistics are compiled from the most recent year for which data is available.
- Other variables may affect the selected metrics, but they were not considered.
- Incomplete data is omitted.